Advisor: David Whelan
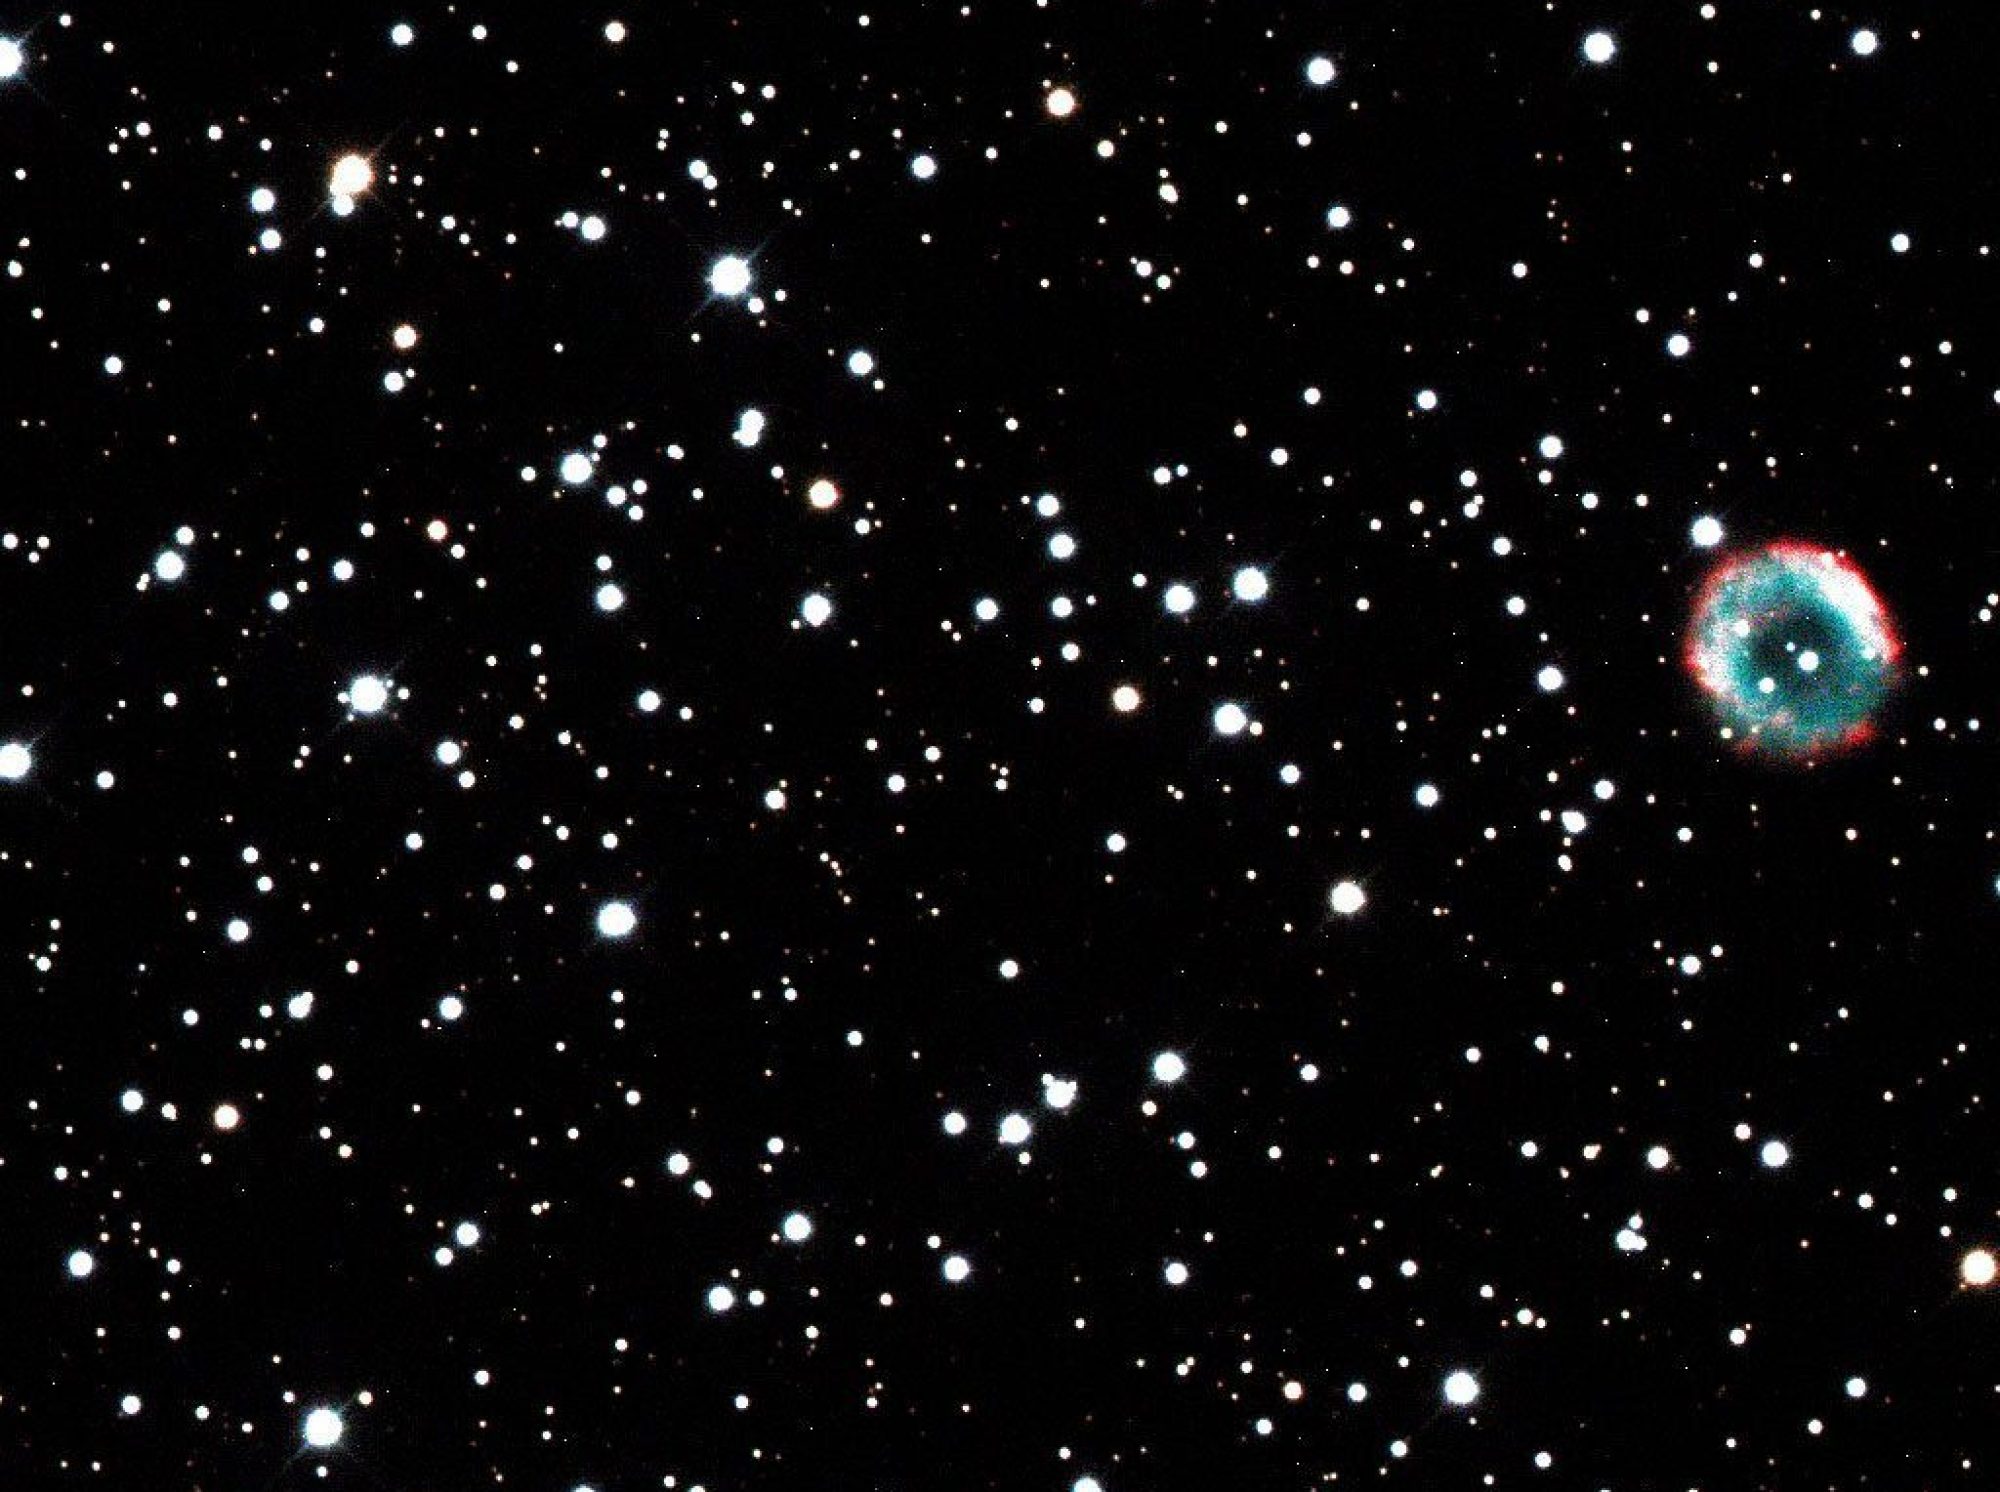
My astronomy research in undergrad focused on understanding emission-line B-type stars, or Be stars for short. These stars get their name from their spectra, which have specific features that set them apart from other stars. The spectrum of a normal B-type star has deep absorption lines in its spectrum from the hydrogen Balmer lines. A Be star’s spectrum has the same lines in it since it’s a B-type star, but one or more of the lines shows up as an emission line instead of an absorption line. Often the emission shows up in the Balmer Hα line (wavelength 6563 Å) and/or the Hβ line (4861 Å), but if present in only one line, the emission is always in the longer-wavelength, lower-energy (i.e. lower-temperature) line.
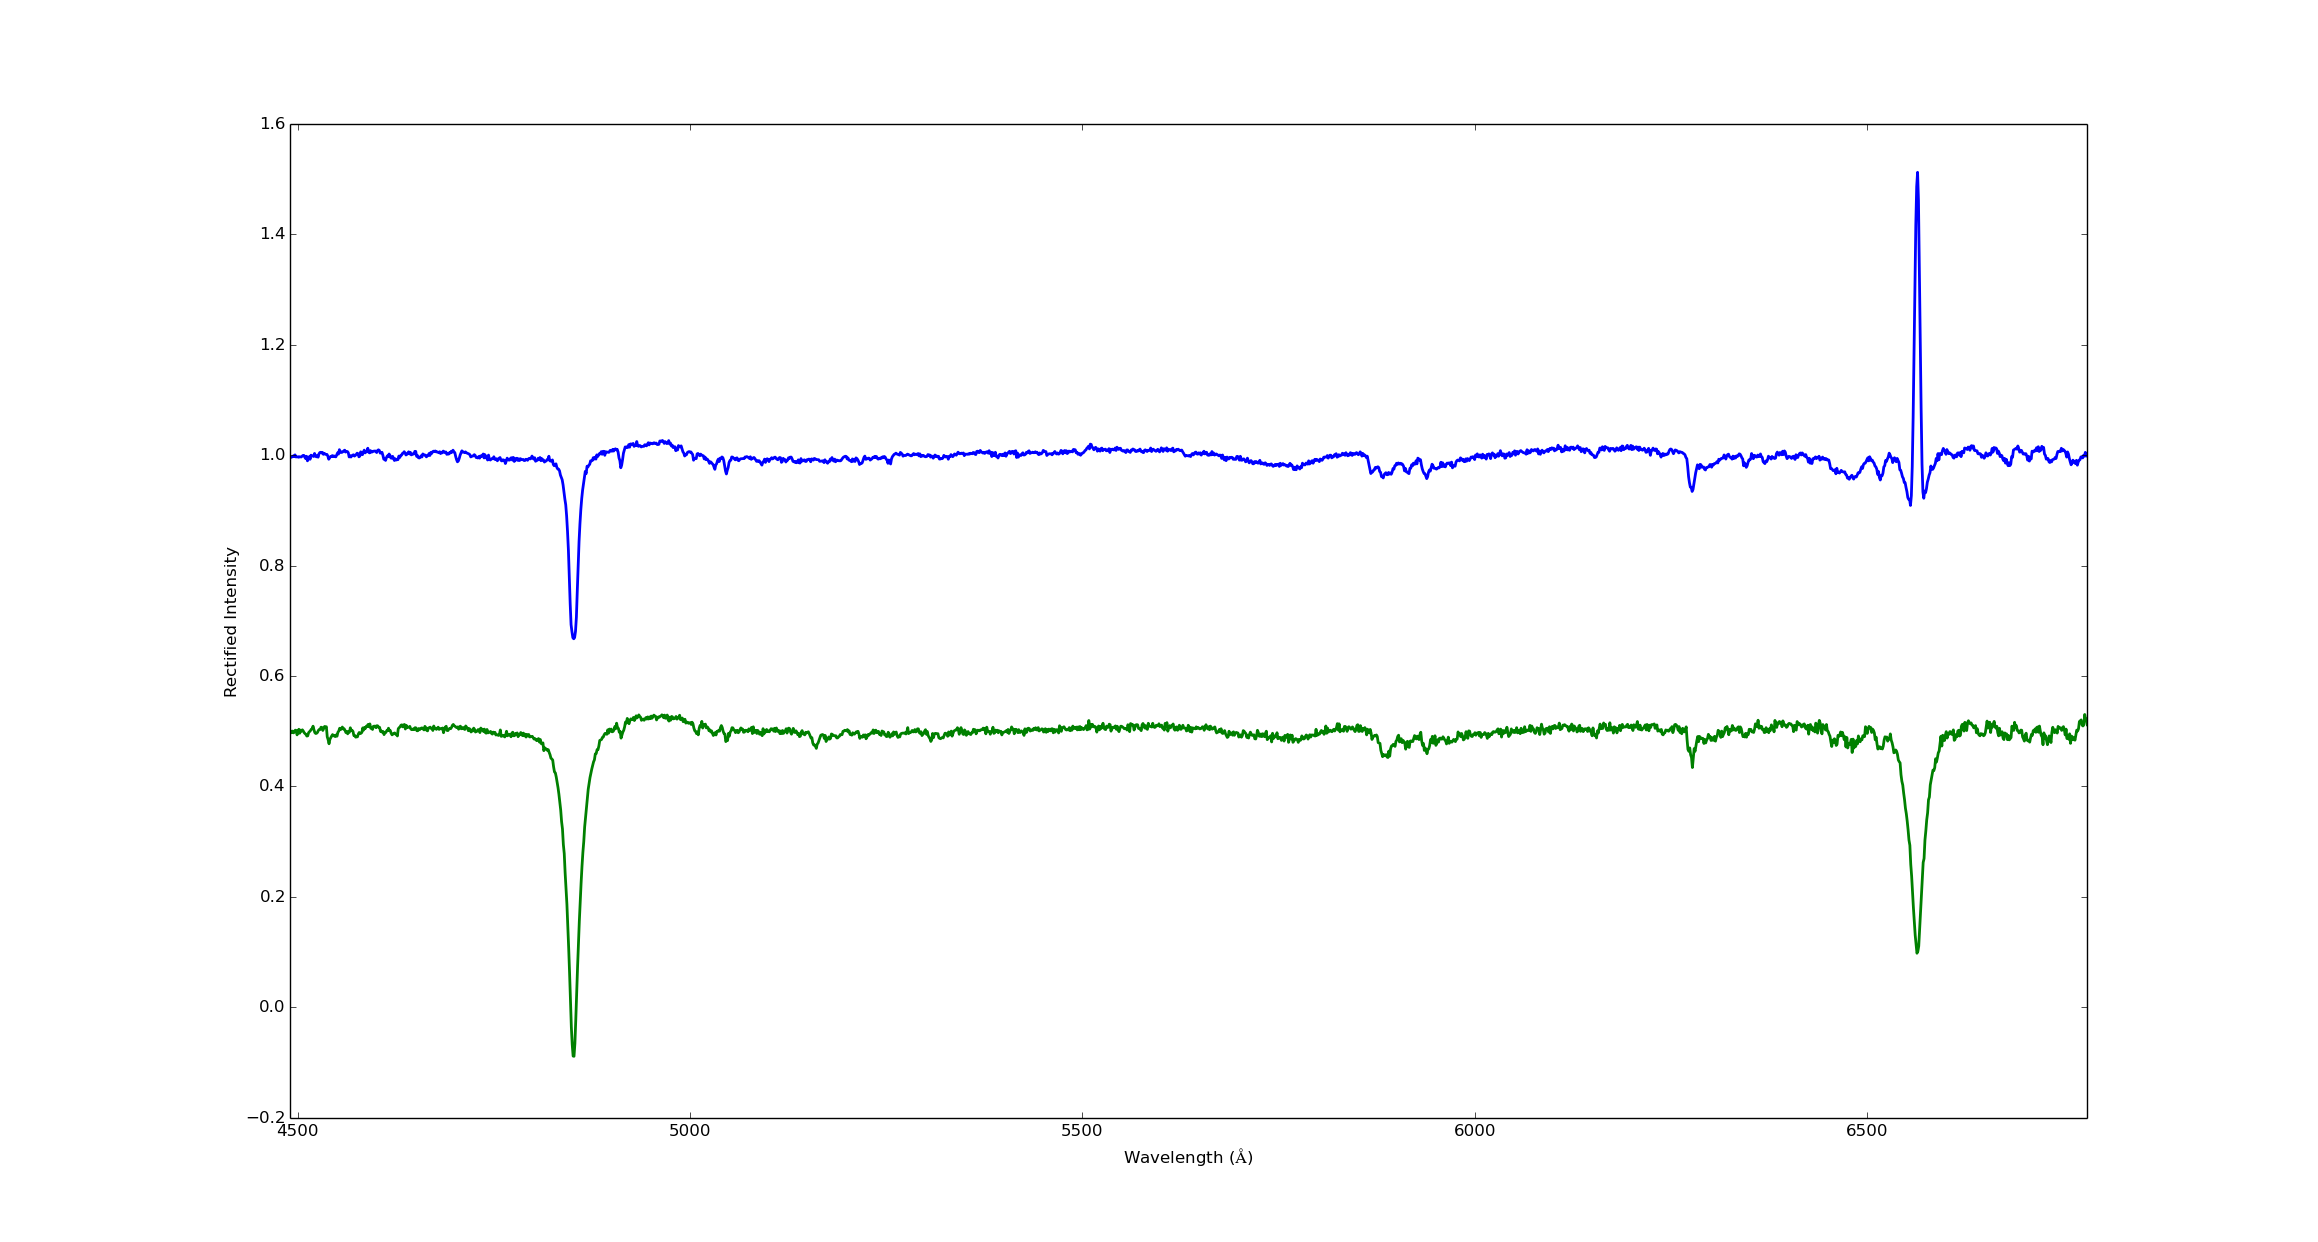
What’s weirder is that Be stars’ spectra don’t always have emission lines in them — you might observe a Be star once, notice the emission lines, ignore it for a few months, then look again and find the emission lines are gone! That’s puzzling enough. Even more puzzling: If you then ignore the Be star for another long while and observe it again, you might find the emission lines are back! Although Be stars have been known since their discovery by Angelo Secchi in 1866, the reason for their strange spectral behavior wasn’t known until well into the 20th Century: Every now and then, Be stars eject gas from their surfaces that settles into a disc around themselves. Most stars don’t do this — our Sun, for example, does not behave this way.
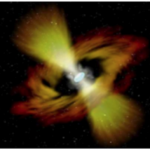
The emission lines in Be stars’ spectra are caused by the gas disc orbiting them, which looks bright against the background of empty space and thus shows up as an emission line. The disc’s characteristics can be inferred by the shape and intensity of the emission lines in the spectrum, as well as by the number of emission lines present. What’s still not well understood is why Be stars gain and lose their discs in the first place. The disc must disappear because it disperses into space over time, but the timescale for a Be star to eject material and form a new disc varies for each individual star, and the exact mechanism to explain why the star ejects material in the first place is not well understood.
In order to study a Be star, you have to find one while it has a disc around it, and although it’s easy to spot a Be star if you take its spectrum (like you can check out in the spectra above), in practice it’s a pain to take spectra of many stars because you need relatively long exposures and typically can’t image more than one star at a time. So, if you’re trying to survey to find Be stars — or, better yet, to monitor a bunch of them to catch their discs in the act of appearing or disappearing — then spectroscopy is difficult to use for that purpose.
That’s where the subject of my senior honors thesis research came in: to develop a quick, easy, and accurate photometric method for identifying and monitoring Be stars.
The advantage of photometry over spectroscopy for this purpose is that you can typically image a whole field of stars at once and pick out which stars are the ones you’re interested in based on the color of light they’re emitting, and you don’t need to capture as much light so it takes less time to run a survey. The disadvantage is that you’re only getting the intensity of the star in a whole wavelength band, rather than the nice wavelength distribution you get from spectroscopy that allows you to see the emission lines characteristic of Be stars.
I put together an observing plan consisting a set of known Be stars for my research, primarily in the Pleiades constellation, as well as a “control group” stars in and around the same region of the sky that were B-type stars but not Be stars. Since Be stars gain and lose their discs over time, my advisor and I took spectra of each star to verify whether each currently had a disc or not.
The goal: observe the known Be stars and normal B-type with appropriate photometric filters available at Adams Observatory and determine whether they can be differentiated from each other.
Poor weather and technical problems led to great difficulty at first, and my time in my research proved quite instructive for learning how to troubleshoot when the data coming back from the night’s observations were inconsistent. I learned not only to extract and reduce photometric data as I would have regardless of how the first steps went, but through this difficulty, I also honed my analysis skills and figured out how to read my data for clues as to how to counteract nonideal observing conditions, as well as how to modify my experimental approach to eliminate the inconsistencies I observed.
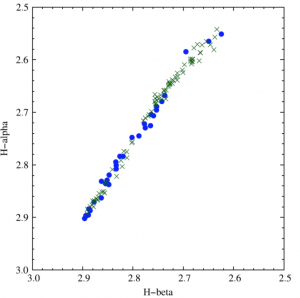
I had an intellectual breakthrough when I came across a then-recent paper by Michael Joner and Eric Hintz, which showed normal stars (including B-type stars) followed a predictable relationship as a function of temperature when their photometric color indices in Hα are plotted against those in Hβ. The color indices are taken to be the difference in intensity between light collected in wide-and narrow-band filters centered on Hα or (Hβ).
I realized Be stars must break the trend that normal stars follow, since the evidence of the presence of their disc shows up as heightened emission in their Hα and Hβ lines.
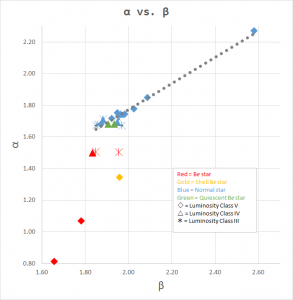
My hypothesis was confirmed upon correcting for existing technical problems and observing my study set of known Be stars and control stars in wide- and narrow-band filters for Hα and Hβ. Without tracking which stars were Be and which were normal, I extracted their photometric data, took differences between wide- and narrow-band intensities for each filter, and plotted them against each other as shown. Then, upon confirming which stars were active Be (from my spectra) and which were known Be stars (from literature), I color-coded my plots to differentiate between them. The results were stark: Be stars occupied a different region of the parameter space than normal B-type stars did. Quiescent Be stars (stars that had lost their discs) blended in with normal B-type stars, implying that if observed during the disc-bearing phase and continually observed over time, their position on the plot would likely change noticeably — enabling them to be monitored over time with my method. Shell Be stars (those with more diffuse discs and distinct spectral features because of that) were also easy to differentiate from the normal B-type stars.
The method I developed proved to be a fast, effective method for differentiating Be stars from normal B-type stars.

Although I learned many months later that the full validity of my results are limited by defects that were discovered much later in one of the observatory’s photometric filters, further study in this direction on Be stars should be able to better characterize how well these stars can be differentiated from their normal counterparts using the simple combination of wide- and narrow-band filters that I used to develop my method. I look forward to the day when more extensive monitoring of Be stars leads to a more complete understanding of how and why they behave in the strange ways they do!
